

What to expect in a Grand Solar Minimum. How does an increase in galactic cosmic rays affect the Earth’s climate and also tectonic activity?
Here is a simplified description of the basic mechanism:
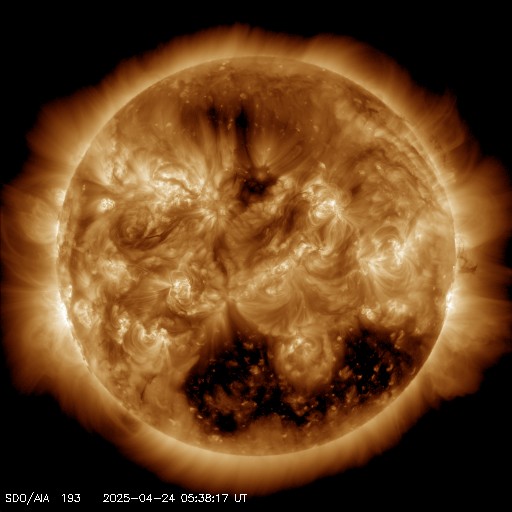
A solar maximum is the period within the 11-year solar cycle of high solar magnetic field and high sunspot count. Sunspots are highly magnetic and visually dark spots or ‘holes’ in the photosphere of the sun, where solar flares can erupt.
A solar minimum is the low activity trough of the 11-year solar cycle (Schwabe Cycle). A Grand Solar Minimum is a period of several successive very low Schwabe Cycles, usually coinciding with phases of climate disruption and – in the long run -cooling. An example is the Maunder Minimum (c. 1645 and 1715) that coincided with the coldest phase of the Little Ice Age. The Little Ice Age, from which we have been emerging since c. 1850, was the coldest period of at least the last 8,000 years, possibly the entire Holocene. Grand Solar Minima recur in clusters roughly every 200-400 years. 27 Grand Minima have been identified during the Holocene (Usoskin et al. 2007). Thus, we were in Grand Solar Minimum about 1/6 of the total time.
The sun emits a magnetic field through the solar wind (flow of charged particles) that reaches as far as the outer planets, this region of the sun’s influence is called the heliosphere.
1. Solar Maximum
During Solar Maximum – when sunspot count is high – a stronger solar magnetic field and solar wind block more cosmic rays from the solar system and this prevents them from entering the Earth’s magnetosphere, atmosphere and lithosphere (Fig. 1).
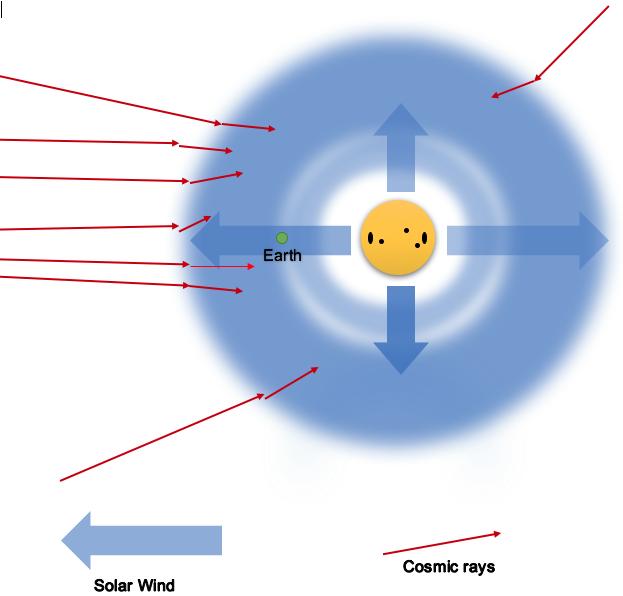
Cosmic Rays, Solar Maximum. Graphic Sacha Dobler AbruptEarthChanges.com
Fig. Solar Maximum, strong solar wind, high magnetic field strength. Dark sunspots indicate increased release of solar flares and Coronal Mass Ejections (CMEs). Much of the galactic cosmic ray flux is blocked from entering the heliosphere of the solar system. Also, more of the electromagnetic radiation such as Gamma- and X-rays from space are blocked from entering the inner solar system. Image: Sacha Dobler, AbruptEarthChanges.com
Cosmic rays are highly energetic atomic nuclei or other particles (e.g. protons) traveling through space at a speed approaching that of light, thus the term “rays” is technically misleading since they themselves don’t constitute electromagnetic radiation. When cosmic rays enter Earth’s atmosphere, they disintegrate in a cascade into subatomic particles, which act as cloud (-condensation) nuclei by ionization and thus instigate low level cloud formation (cloud seeding). See: NEW STUDY: Cosmic Rays, Solar activity have much greater impact on Earth’s climate than models suggest.
Cosmic rays are accelerated by distant supernovae and other violent events in the cosmos.
The cosmic rays we are primarily concerned with here in the context of solar cycles are called galactic cosmic rays – high energy particles from outside the solar system, but recent studies have shown that many of them originate outside of our Milky Way galaxy and thus are actually inter-galactic cosmic rays.
The Sun itself also emits cosmic rays (solar cosmic rays), but these are of lower energy density and thus have less effect on Earth. So, when a quieter sun during solar minimum emits less solar cosmic rays, this does not counterbalance the cloud seeding effect of the increased galactic cosmic rays.
In addition, in solar maximum, the strong solar magnetic field not only blocks out more cosmic rays, but also more of the electromagnetic radiation from space, such as harmful gamma-, X-rays and UVC.
During a said succession of several strong 11-year- cycles (Schwabe) cycles – a Grand Solar Maximum – we see a more benign and stable climate, less variability in precipitation/ wind and a trend of general warming, as in the Roman Warm Period, the Medieval Climate Optimum and the recent Modern Grand Solar Maximum between the 1940s and c. 2000, when the level of activity was high, exceeding 100 in the peak sunspot number. (Usoskin et al. 2003). Not every peak in solar activity between two Grand Minima is classified as a Grand Solar Maximum.
During these very active times, there is only a limited increase in solar output in terms of warmth and light (Total Solar Irradiance). For the 11-year cycle, this fluctuates in the range of +/- 0.1 %.
Total Solar Irradiance (TSI) is a measure of the solar power over all wavelengths per unit area incident on the Earth’s upper atmosphere. It is measured perpendicular to the incoming sunlight.
At the bottom of the Maunder Minimum, the TSI was 1363.5 Watt per meter3 and at the height of our apparently ending warm period in 2000 it was at 1366.5 W/m3, that’s an increase of only 0.3 % in solar energy emission from the coldest climate of the last 8000 years to the presently very different one.
So, it is not as simple as: “a more active sun emits more heat and thus “warms” the planet more than an inactive sun” by more Total Solar Irradiance. This simplification often gets construed by the proponents of the theory of anthropogenic (man made) climate change, when they argue the variability in solar activity could affect climate only minimally.
As far as temperature is concerned, what is crucial is not the energy that leaves the sun, but how much of this energy is blocked by clouds and how much reaches the Earth’s surface and how much is reflected back into space by ice and snow. TSI is a good indicator for climate, but it is part of the effect, rather than the main cause.
It has been textbook knowledge that saturating the air (100% relative humidity) is not always enough to form a cloud or droplet. “The water vapor molecules need a site to condense on. This site is called a Condensation Nucleus and the process referred to as heterogeneous nucleation. Cloud condensation nuclei (CCN) are about 1 micron in size.”
In a groundbreaking study of Dec, 2017, Professor Svensmark stated, it had until now wrongly been assumed that small additional nucleated aerosols would not grow and become cloud condensation nuclei, since no mechanism was known to achieve this.
“The new thing is that there exists an amplification mechanism that is operating on clouds in the atmosphere,”.
“Quantifying the impact of solar activity on climate from observations is found to be 5-7 times larger than from solar irradiance, and agrees with empirical variations in cosmic rays and clouds.”
“This can therefore also explain why climate over the last 10,000 years correlates with solar activity. “
(See also the sobering attempt by Dr. Leif Svalgaard to debunk Svensmark’s paper at the end of this text.)
What’s important is the connection of solar activity, cloud seeding, and in the long run, snow cover, “whitening”.
In the c. 200 years cycles of Grand Solar Minima, Solar Maxima are the warm and but wetter “solar seasons” of a generally benign climate.
2 Solar Minimum
Update 5.29. 2019: The next Grand Solar Minimum has (very likely) begun: NASA predicts lowest solar cycle in 200 years
During a solar minimum – and particularly – in a Grand Solar Minimum, more cosmic rays enter Earth’s atmosphere. Here, these high velocity particles (mostly protons) collide with atmospheric atoms and dissociate in a cascading mode into smaller subatomic particles. These particles act as cloud nuclei by ionization and propagate low level cloud formation. Some particles may reach the Earth’s surface and even penetrate it. In this way, more cosmic rays accelerate storm formation, erratic rainfall, snowstorms, hail, local flooding, and in the long run – global cooling. (Fig. 2).
We add to this: Earthquakes, volcanoes, lightning, and other electric events and an enhanced risk for a solar flare that can disrupt our power grid.
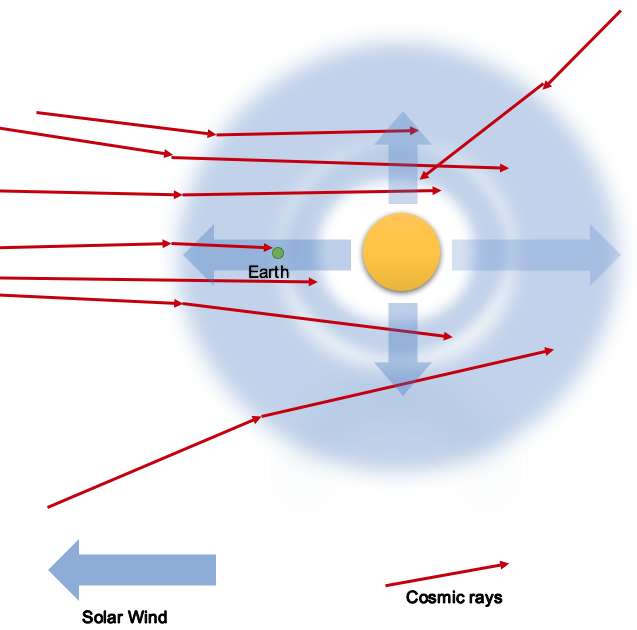
Fig. 2 Solar Minimum: Week Solar magnetic field, more galactic cosmic rays reach Earth’s atmosphere and surface. Graphic: Sacha Dobler AbruptEarthChanges.com
But – somewhat counterintuitively – Grand Solar Minima, the cooler phases, are historically prone to drought and, due to jet stream disturbances, also singular heat waves and wild fires increase (see flooding and drought, below).
It is primarily the climate instabilities and erratic weather, rather than the actual drop in temperature, that initially disrupts agriculture and civilization. During the Little Ice Age, temperatures across the Northern Hemisphere arguably declined by only 0.6 °C (1.1 °F) relative to the average temperature between 1000 and 2000 CE (according to Encyclopedia Britannica), but frost and snow events and crop failures were devastating. A “normal” Grand Solar Minimum initially manifests not so much as a “Mini Ice Age” but could more appropriately be called a “Bad Weather Age” with climate extremes.
Inversely, solar maxim do not directly ensure warm climate. For instance, in the solar activity high in around 1600 the climate stabilised to some extent, but temperatures remained very low, this was at the bottom of the Little Ice Age. (See figure 4).
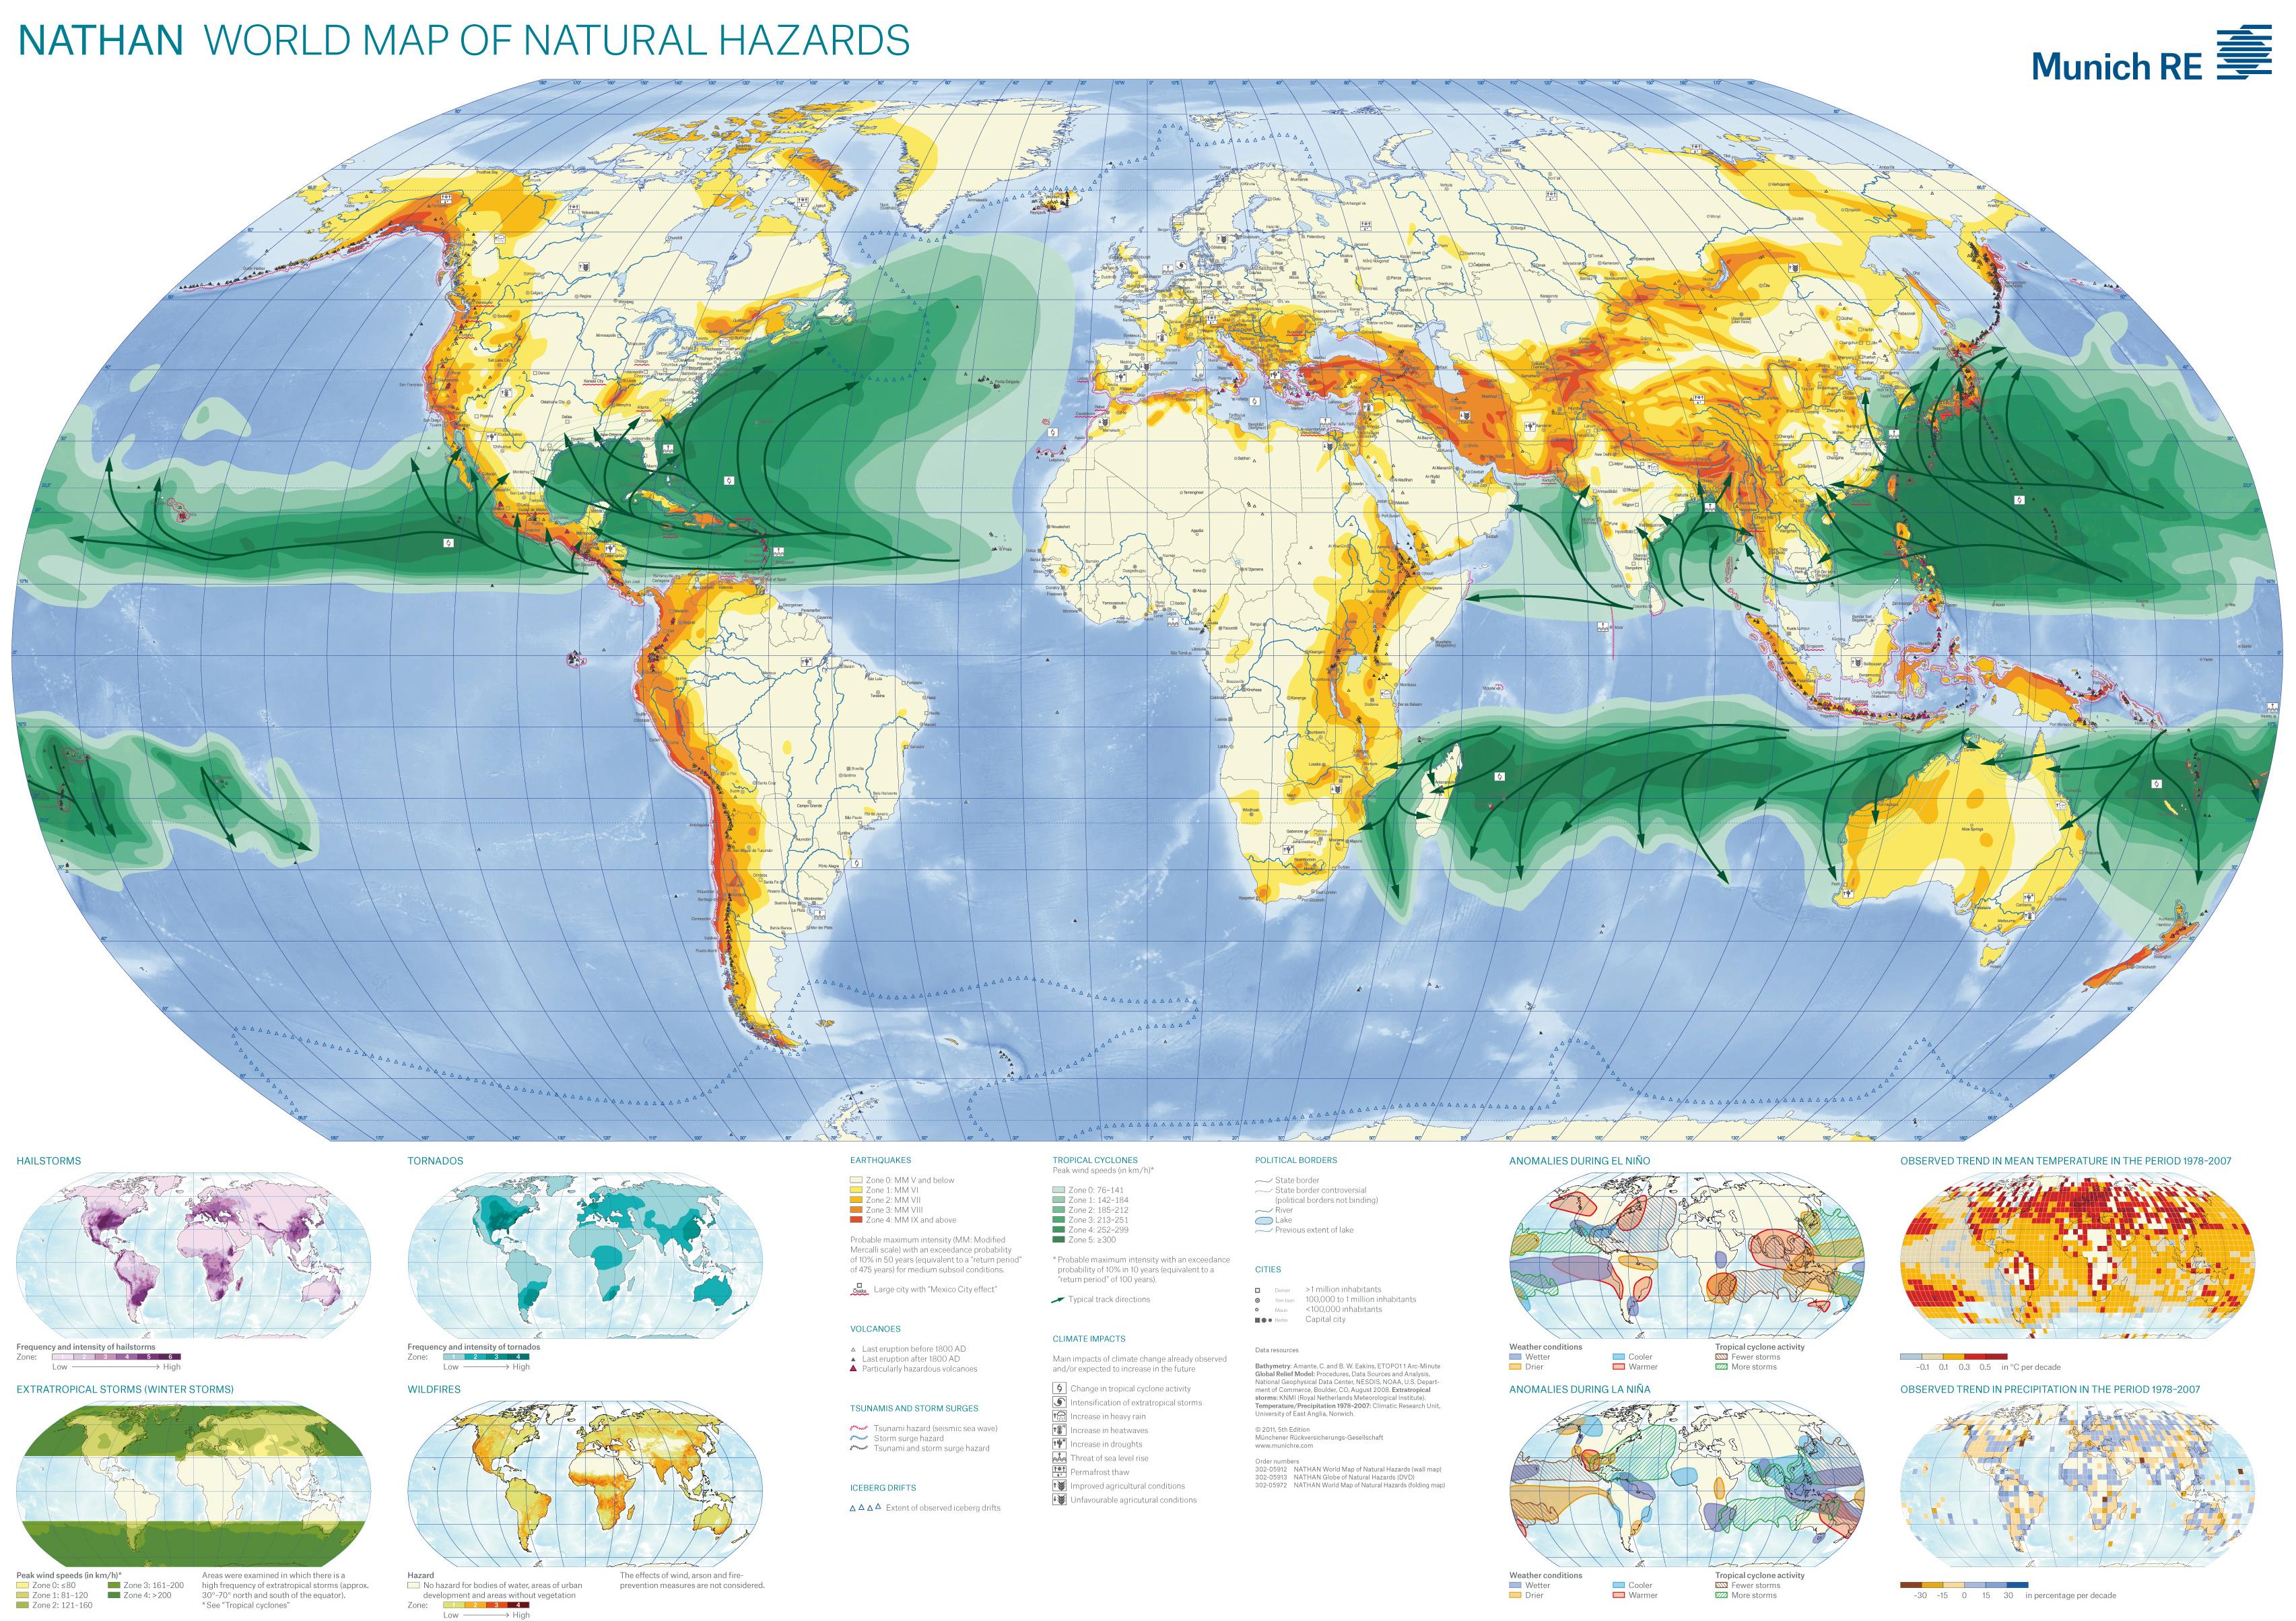
Even when – in a given year – average temperatures are only slightly below normal or even average, all that is needed is one unseasonal late snowfall or hailstorm to ruin crops for a season (as happened in France and Midwest USA in spring 2016 and 2017). These anomalies, (including earthquakes and volcanoes; see below) can be expected to increase generally along the usual risk zones for natural disasters (see global map). As a generalization, it can be said for any given region: Expect more of the same. Plus, in the long run: overall cooling and droughts.
(For the current trend of decline into a solar minimum, since Earth’s magnetic field is also weakening, and thus entering space radiation (e.g. solar UV radiation) is increasing, the jury is still out on overall long-term temperature changes for the coming cycles. (see also 3.2).
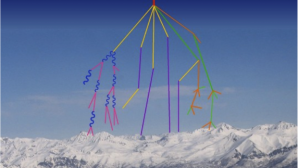
Fig. 3: Galactic Cosmic Rays enter Atmosphere IMAGE: NOAA
During Solar Minimum, not only are there less sunspots, but these are also concentrated at the solar equator, whereas in solar maximum, they also appear in the range of the 30-50° latitudes. Also, the 11-year (Schwabe) (Cycles) can be elongated up to 22 years.
Summary of the feedback loop of climate downturn in a Grand Solar Minimum:
— Weak Solar Magnetic field (weak Solar Wind)
— More cosmic ray influx from space
— Ionization of atmospheric molecules –Cloud nucleation
— More cloud formation and erratic precipitation. Long-term cooling
— More clouds reflect solar radiation
— More snow and Ice reflect solar radiation – more long-term cooling.
A Grand Solar Minimum – as a succession of several very low solar cycles – occurs approx. every 200 years. The last notable one was the Dalton Minimum c. 1790 – 1820, which was followed by the end of the Little Ice Age, the 2nd Industrial Revolution, population expansion and the beginning of the modern global warming trend (which began c. 1850 and lasted until c. 2000).
Flooding and Droughts
In a Grand Solar Minimum, cosmic rays trigger larger flash floods, hailstorms and – due to jet stream disturbance and mixing of atmospheric layers – local long-duration precipitation events (e.g. atmospheric rivers).
At the same time as the increased local flooding events occur, more cloud cover and less sea surface water heating means less evaporation of sea water, specific humidity is reduced, overall rainfall amounts are reduced, despite regional precipitation records and flooding. In general, water tends to remain in the cloud cover for longer durations. When clouds are rained out, this happens more violently, whereas the regular transport into the continents is diminished. As a result, in many areas, droughts are historically more prevalent during Grand Solar Minima. This can then be marketed as the result of “Global Warming”, implying man-made global warming, of course. Even though there has been no global warming since 2000. So, due to the shifting jet streams and changing wind patterns, singular heat waves and more wild fires are expected. During the coldest period of the Maunder Minimum, Alaska and the North Atlantic were even warmer than normal.
High solar activity correlates well with high specific humidity in the atmosphere (see Fig. 3) So, in a solar maximum, less cosmic rays means less clouds, more sunshine, but more water vapor in the atmosphere. Water vapor itself (gas, not condensed droplets) is a greenhouse gas 10x more effective than CO2, thus another feedback mechanism towards warming and stable weather is generated during solar maximum. In addition to the general higher humidity, fair weather means more difference between day and night temperature, also amounting to more dew formation.

Fig. 4: Precipitation Climate and Solar modulation of the last 1000 years.Blue: Reconstructed Temperature Storch et al 2004, Red: solar modulation, after Muscheler et al 2007,
Black: Reconstruction of precipitation amounts for the edge of the Tibetan Plateau. Sun & Liu (2012).
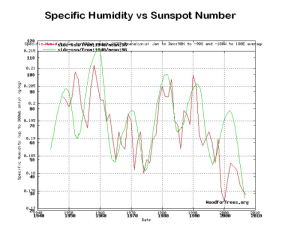
Fig. 5: Correlation of specific humidity and Sunspot Numbers within Schwabe cycles (smoothed over 100 months) 1940 to 2010, around 30,000 feet (tropopause). Sun spot count: green. Source tall bloke blog solar system dynamics: August 8, 2010
What this means for agriculture and civilization itself: In a Grand Minimum, lower specific humidity at the same temperature means lower relative humidity, which means less dew formation to nourish grass plants, most of these plants can sustain themselves from dew during extended rain-free periods on dry top soil, whereas most of the more complex cultural plants require ground moisture from regular rainfall or irrigation. Increased winds further accelerate soil drying.

Precipitation vs. Sunspot numbers. February precipitation in Germany compared to changes in sunspots. Shown is the optimum positive correlation (r = 0.54) with a solar lag of +17 months. Solar cycles are numbered 14–24. The probability that the correlation r = 0.54 is by chance is less than 0.1% (p < 0.001). Source: Science Direct.com.
Dew forms on leave surfaces with the aid of microscopic particles on the leaves – which serve as condensation nuclei – at night, when temperatures are low and thus relative humidity is high, after which grass is wet in the morning. The condensed water droplets are then absorbed through the leaves or roots. Porous soil also absorbs minute amounts of dew. Not only is animal husbandry based on grass growth, but cereals, e.g. wheat, rye etc. are grass plants that can live on dew for extended periods of time, thus the related food production can be devastated by lower humidity alone, without a decrease in rainfall.
So, in Grand Solar Minimum, local droughts and crop failure can be caused not only by less rain and more winds, but simply by lower specific humidity. This may not even show up on climate records (temperature and precipitation). Such droughts will most likely be misinterpreted as drought from warming and evaporation.
Droughts in frigid climates lead to more sublimation of snow than is replenished by snowfall (evaporation of ice). Thus, glaciers may disappear from the top down, in continuous sub-zero temperatures, this can then be marketed as “melting” due to warming (as for instance on the peak of Kilimanjaro). in Antarctica, there are snow-free rock deserts known as “Antarctic Oasis” also in constant sub-zero temperatures.
UV Radiation
Crop damage, local surface heating, wildfires and biological damage can all be accelerated by an increase in UV radiation, by the following mechanisms:
1.) There is a direct correlation of cosmic rays and ozone depletion. measured since 1980. Ozone depletion – as in solar minimum – means more harmful UV-B and C reach Earth’s surface. A Study from 1980–2007 – covering two full 11-yr cosmic ray (CR) cycles, – clearly shows the correlation between CRs and ozone depletion, especially the polar ozone loss (ozone hole) over Antarctica.
2. ) The ongoing reduction in geomagnetic field strength lets in more cosmic rays from space and also more UV radiation from the sun. (see below). Earth’s thermosphere, in the upper atmosphere, is heated mainly by EUV (Extreme Ultraviolet) waves from the Sun.
Earthquakes and Volcanos
As a further complication in a Grand Solar Minimum, cosmic rays that make it to Earth and enter the surface, can trigger earthquakes and volcanoes and other tectonic anomalies. The penetrating particles (cosmic ray muons) from space decrease the viscosity of silica-rich magma. See: “Explosive volcanic eruptions triggered by cosmic rays: Volcano as a bubble chamber.”
As a consequence of these eruptions, increased amounts of volcanic aerosols and gases can generate global dimming and further cloud nucleation, leading to more cooling and crop failure, another feedback mechanism.
So, when you read a news story that says: “Volcano triggered ancient ice age”, it usually leaves out that previous known cold periods took place during solar minima, and also that the biggest accumulation of eruptions also take place at the beginning of the decline into a Grand Solar Minimum. Cause and effect become construed. In recent history, the largest duration of cooling that was attributed to an isolated volcanic eruption was only 1 year (the year without summer in 1815, Tambora). And that was also at the end of the Dalton Minimum (c. 1790 – 1820). See also the paper: Cosmic-solar radiation as the cause of earthquakes and volcanic eruptions:
“Fluctuations of cosmic-solar radiations are charging the ionosphere. That results in anomalies of geomagnetic field which causes the generation of Eddy current. The Eddy current heats the rocks in the faults and consequently the shear resistant intensity and the static friction limit of the rocks would decrease. This is the main process that triggers earthquakes and volcanic eruptions.“
Here, as well, the usual risk zones are considered.
Ocean warming:
As volcanic activity increases, this also affects underwater volcanoes. 2/3 of all volcanoes are underwater and erupt mostly unnoticed. This is most likely why the floating sea ice of the Arctic had (officially) been shrinking until recent years, while the land locked Antarctic ice was growing. In 2015, we learned that “Heat From Deep Ocean Fault Punches Hole in Arctic Ice Sheet”. By now, also Antarctic ice shelfs are affected by heat from below, in 2017, scientists “discover 91 volcanoes below Antarctic ice sheet”. Update 1-29-2018 the phenomenon is now also observed in Greenland : PUZZLING HEAT FROM DEEP INSIDE THE EARTH IS MELTING GREENLAND’S GLACIERS
Lightning:
Cosmic rays reveal the secrets of thunderstorms
(Scott et al, 2014) suggest that the solar wind controls lightning on Earth: “increase in Galactic Cosmic Ray flux may directly trigger lightning through ‘runaway breakdown’ of electrons, leading to breakdown.”
Historical discussions of solar activity and climate:
Sir William Herschel was the first to seriously consider solar fluctuation as a source of climate change. In 1801, he noted the correlation of low sunspot cycles (Grand Solar Minima) and weather worsening (using proxies such as wheat prices and crop failure.)
““The result of this review of the foregoing five periods is, that, from the price of wheat, it seems probable that some temporary scarcity or defect of vegetation has generally taken place, when the sun has been without those appearances which we surmise to be symptoms of a copious emission of light and heat.”
-Sir William Herschel, Phil. Trans. Royal Society. London, 91, 265 (1801)
The progression of visible sunspots can be observed with a simple telescope or binoculars, in order to get a rough picture of the state of our sun (see below). The next two contributors to increased space energy on Earth require sophisticated instruments.
Social / political developments: Grand Solar Minimum = Age of Peace
It may be counterintuitive: Grand Solar Maxima, with a stable and more favorable climate – are also periods of increased mass excitability, war and genocide. In fact, throughout the last millennium, there were 4.6 times as many deaths from war, genocide and persecution during Grand Solar Maxima than there were in Grand Solar Minimum. In contrast, Grand Solar Minima – the ‘bad-weather periods’ – were times of relative peace, reason and of improvements of human rights.
In the 1920s, the Russian scientist Alexander Tchijevsky discovered that social excitability, wars and rebellions unfolded primarily at the peaks of the 11-year solar cycles (Schwabe- cycles).
I found that within the past 1000 years, what is true for the 11-years cycles, also applies to the non-periodical cycles of Grand Solar Minima and Maxima, recurring roughly every 200 years. The correlation between war deaths and grand maximum is r= 0.9 (very high correlation).
Solar History
Ebook and paperback available here
3 Further astronomical trends that contribute to climate- and tectonic- instability
At the same time as our solar magnetic field has been waning – as solar activity is currently declining – two related trends with the same effect are observed, both contribute to increased incoming space energy and particularly, cosmic rays on Earth:
3.1 the diminishing of Earth’s magnetic field, and:
3.2 the moving of our solar system into a zone in the cosmos of lower magnetic protection, the “Local Bubble”.
3.1 Weakening Earth’s magnetic field
Earth’s magnetic field has a similar function as the Sun’s magnetic field. It shields us from incoming cosmic rays and harmful electromagnetic radiation (such as UV B-C and gamma rays).
Earth’s magnetic poles are moving towards each other, at the same time Earth’s magnetic field is weakening, both phenomena are taking place at an accelerated pace. It’s beyond this text how exactly the Sun’s and the Earth’s magnetic fields are causally related. The following numbers are from magneticreversal.org:
Since the mid 1800s until 2000 – in about 150 years – the Earth’s magnetic field had weakened by 10%. Then, from 2000 to 2010, it weakened another 5 %, an exponential decline. In 2015, ESA’s SWARM mission, measuring the magnetic field, concluded that both trends of acceleration are continuing, but they assume that this will not be a problem in the near future.
Around 1900, the North Pole was moving only a few kilometers per year. Today, the North Pole is moving 80km per year and rushing towards Siberia.
As we see, the two phenomena are proceeding hand in hand. And the period of modern global warming was strongly correlated with the very strong solar activity about 1850- 2000, peaking in 1950- 2000. In this period, solar magnetic field – blocking out cosmic rays – was not only strongest in the last 400-year-long cycle, but it was the strongest in the last 11,000 years. That is roughly the time span of the current Holocene (our current interglacial warm period, which followed the abrupt end of the Younger Dryas cooling period).
Here it is important to note that during the Maunder Minimum, the geomagnetic field was much stronger than today, and this was able to buffer some of the harmful effects of the weak solar activity and the increased cosmic rays. In fact, Earth’s magnetic field was relatively strong throughout the last 3000 years. Thus, also in regards to this current combination, we are entering unchartered territory in terms of incoming space energy. During past Grand Minima, also aurora displays were rare, even the observed side of the Sun’s halo during total eclipse is smaller.
Thus, we either simply have more erratic weather and cooling due to cosmic ray influx as in past Grand Minima, OR some of the cooling is counterbalanced by an increase of entering electromagnetic radiation, primarily UV – which can heat the atmosphere – unlike during previous minima of the last 3 millennia.
At any rate, influx of harmful electromagnetic radiation (UV B-C and gamma rays) is increasing with the weakening Earth’s magnetic field.
Power grid disruption and solar storms
Although there are on average less severe solar storms and flairs during Grand Minima, the ones that do erupt can create greater damage to our power grid. Our modern day electronic age has not been tested by a strong solar flare or Carrington type solar storm. During the Maunder Minimum, solar activity was very weak, but Earth’s magnetic field was still strong and was thus abel to shield us from some of the effects of solar storms and Coronal Mass Ejections (CME). Later, in 1859, although occurring during a short peak in solar activity, the Carrington Solar Storm disrupted the global telegraph net involving short circuits and ground induced currents. With today’s reduced Earth’s magnetic field we are in unchartered territory also in regards to technology. On the bright side, it can be added that the telegraph grid of 1859 was not adapted to solar storms at all, with insufficient or no grounding, so the direct comparison is flawed.
Back in 2004, a group of researchers from IBM measured the flux of neutrons from cosmic ray collisions and used their results to predict the error rate in computer memories another electronic logic devices. Their predictions closely matched the observed rate of error, suggesting that neutrons are indeed an important source of problems in computing.
3.2 The local Bubble
Our movement in the galaxy involves long term changes with their effects hard to predict. The following is again mainly from a narration in “Where are we going” by Suspicious Observers, who refer to this as our 3rd collapsing shield. This change involves the movement of our entire solar system in our arm of the Milky Way galaxy. Our system is moving out of a zone of higher density of gases and dust – the Local Cloud – into a “void” area, the Local Bubble that was created by numerous supernovae, a zone in which the density of magnetized hydrogen is 6 times less than in our current environment. The magnetized hydrogen in the Local Cloud also protects us from cosmic rays and harmful electromagnetic radiation. The process of exiting takes place within the next centuries, therefore it’s a gradual process, but it has started already and it must be assumed that the further we proceed into this void, the greater the effects of future Grand Solar Minima will be on Earth.
It is not clear how our position in the local cloud is connected to Earth’s and to the Sun’s magnetic field progression. But a progression of the observed trends of all three parameters will expose us to more space energy and particularly, cosmic rays.
4 The ongoing increase in cosmic rays and the next Grand Solar Minimum
Update 5.29. 2019: The next Grand Solar Minimum has (very likely) begun: NASA predicts lowest solar cycle in 200 years
4.1 The next several solar cycles
As we see below, all the conditions are present to suggest that we have entered the next Grand Solar Minimum, this matches some of the symptoms on the ground: Antarctic ice has been increasing, Arctic sea ice is recovering, the all time US record for natural disasters was just broken in 2017. Every year, hundred-year-records for various climate anomalies are broken. Earthquakes have been on the rise over the past decades. Update Dec 2018: Iceland’s glaciers grow for first time in decades
However, the exact progression over time is hard to predict. In the following considerations, we leave out the possibility of other astronomically induced disturbances such as solid space debris inpacts.
Preparedness
Warning of changes in solar activity as well as monitoring of other astronomical anomalies, and reorganizing our society accordingly, is crucial for the survival of our civilization. Increasing our adaptability to all scenarios of harsher environments should be a continuous endeavor, independent of the future solar conditions. In my personal opinion, we should keep our infrastructure, dwellings and food production/ sovereignty adapted to Maunder Minimum- conditions at all times, including relocating from high risk zones, including all population centers, lighting protection, having optional concrete reinforced storm shelters, 1-year+ food provisions. (a year’s worth of wheat, rye or rice can be obtained for only 100- 200 USD). More on food storage and preparedness here.
John Casey and others have petitioned to name the coming modern minimum “Eddy Minimum” after the late astronomer John A. Eddy.
However, in order to prevent the Crying-Wolf syndrome, a Grand Solar Minimum should only be officially declared after it has started – that is after more than one very low cycle. Since we are dealing with several new settings in Earth’s environment, no one knows for sure, whether we are already in the next Grand Solar Minimum, or whether we will rebound once more, for the time being.
By all likelihood, the currently very week solar cycle (24) will give us – within the next 2 years – a solid foretaste of the next one (trough of SC 25). In early 2018, sunspot activity is already at the level of the predicted minimum set to be in 2 years. We will reach the trough of the latter solar cycle (25) in 2029/ 2030.
Whenever the final drop takes place, during a Grand Solar Minimum, we expect more severe weather, erratic cloud formation, stronger winds, storms, hail, crop failure, but also droughts, earthquakes, and volcanos and in the long run, global cooling. We add to this: lightning, electric discharge events, meteors that can penetrate farther into the atmosphere (see Black Death and Abrupt Earth Changes in the 14th century, page 51), and the risk of solar flares that can disrupt our power grid due to our weakened shields, even though overall solar storms are less frequent.
In a cynical way, the proponents of the false dogma of anthropogenic climate change or “Global Warming” are predicting the same climate extremes as are expected in a Grand Solar Minimum – except the long-term cooling. But they attribute them to the wrong causes. And this might be the reason – other than sheer desperation – why the IPCC and Al Gore are still pondering the theory of anthropogenic global warming, even though there has not been any warming in 17 years. If the trends in cosmic ray flux continue, many of Al Gore’s gloomy predictions will come true (except the long-term warming) and the people on the fence on whether climate change is “real”, will quickly find out that it is real, but the fact that it will have nothing (or little) to do with human greenhouse gases will be disregarded by the panicking masses.
It is now well proven that temperature records have been falsified to create the illusion of runaway global warming. Nevertheless, I personally don’t find it productive to ponder on each snowstorm as evidence that the globe is cooling instead of warming. After all, the doctrine of CO2 driven climate change was designed to cover all expected anomalies, except the long-term warming. Al Gore has already prepared the way to explain cold events as a result of Global Warming (man-made Climate Change) only 5 years after the Inconvenient Truth. As early as in 2011 Al Gore claimed that “heavy snowfalls are completely consistent with what they (scientists) have been predicting as a consequence of man-made global warming”. Thus, they have arrived at the levels of a religious cult in which everything that happens concerning weather and climate is the result of human action.
Record storms are evidence that – first and foremost – climate variability is increasing. The actual drop in average temperature could be a relatively late concern in the progression of the next Grand Solar Minimum (see 3.1).
When we look at the correlation of solar activity and temperature, keep in mind that what disrupts civilisations, is foremost “bad weather”and crop failure rather than an actual drop in temperature. Even glaciation usually begins with erratic snow fall before a substantial drop in temperature sets in.
Thus far, solar cycle (24) is already the “Third weakest solar cycle since 1755 in terms of accumulated sunspot number anomalies from the mean value at this stage of the solar cycle.” It began in 2008, which puts us about nine years into the current cycle.
As we entered 2018, “no sunspots appeared from December 27, 2017 until January 4, 2018. As solar cycle 24 declines to a minimum over the next two years, we should see longer and more numerous periods of no sunspots. On January 4, the daily sunspot number was 13, indicating 3 sunspots in one sunspot group, although Spaceweather.com reported “no sunspots on that day.”
Update: June 2019:
In June 2019, NASA predicted SC 25 to be the lowest solar cycle in 200 years. This will already put us at early Dalton Minimum conditions at least for the next decade.
5. Temperature Predictions:
- In 2013, Mike Lockwood, professor of space environmental physics at Reading University, UK, told new scientist there is now a 25 per cent chance of a repetition of the last grand minimum, the late 17th century Maunder Minimum, when there were no sunspots for 70 years. “Solar activity is declining very fast at the moment. We estimate faster than at any time in the last 9300 years.”
- The following graph shows the recorded and predicted temperatures as plotted by Ole Humlum et al from their 2011 paper: “Identifying natural contributions to late Holocene climate change” (Elsevier)

Fig. 6: O. Humlum et al. / Global and Planetary Change 79 (2011 Central Greenland (GISP2) surface temperature of the past 4,000 years (blue line). Natural cycle modelled and forecasted data are shown by the green line. The coefficient of determination (r2) for the hindcasting period is 0.63.)
“The causes of long (millennial scale) climate changes are generally poorly understood, and the issue is important for understanding the natural climate variability, as illustrated by ice and ocean cores. Also, the lack of a CO2 cycle at millennial time scales underscores the independence of such long climate variability from anthropogenic greenhouse enhancement.”
“The warming following the Little Ice Age is generally perceived as a natural recovery from the previously cold period, and the effect of anthropogenic greenhouse enhancement is assumed to become important only after 1975 (IPCC, 2007). Our simple cyclic model (Fig.) is able to forecast the main features of this recorded warming until 2010, underlining that a significant part of the 20th century warming may be interpreted as the result of natural climatic variations, known to characterise at least the previous 4000 years.”
- Prediction of the next 3 very low solar cycles
Here are the results of a study by V. V. Zharkova et al, 2015.
Heartbeat of the Sun from Principal Component Analysis and prediction of solar activity on a millennium timescale.
The summery is by Anthony Watts, August 9, 2016:
“After studying full-disc images of the sun’s magnetic field, Professor Valentina Zharkova of Northumbria University and colleagues, discovered that the sun’s dynamo is actually made of two components – coming from different depths inside the sun. The interaction between these two magnetic waves either amplifies solar activity or damps it down. Professor Zharkova’s observations suggest we are due for a prolonged period of low solar activity.”
Professor Valentina Zharkova:
“We will see it from 2020 to 2053, when the three next cycles will be of a very reduced magnetic field of the sun. Basically, what happens is these two waves, they separate into the opposite hemispheres and they will not be interacting with each other, which means that resulting magnetic field will drop dramatically nearly to zero. And this will be a similar condition like in the Maunder Minimum.
What will happen to the Earth remains to be seen and predicted because nobody has developed any program or any models of terrestrial response – they are based on this period when the sun has maximum activity — when the sun has these nice fluctuations, and its magnetic field [is] very strong. But we’re approaching the stage when the magnetic field of the sun is going to be very, very small.”
Heartbeat of the Sun from Principal Component Analysis and prediction of solar activity on a millenium timescale V. V. Zharkova, S. J. Shepherd, E. Popova & S. I. Zharkov
She [Zharkova] suggests it could be a repeat of the so-called Maunder Minimum – a period in the 17th century with little solar activity that may have influenced a cooling on Earth.
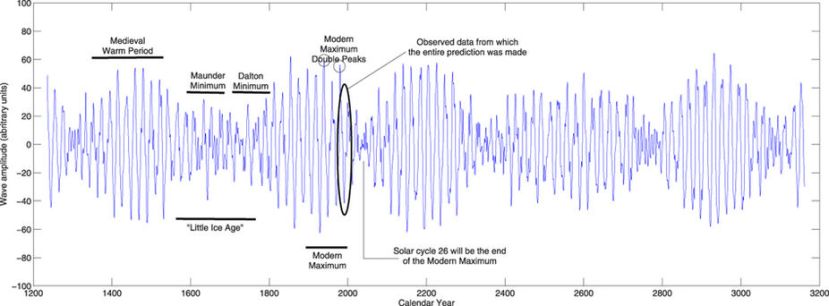
Fig. 7: Plot from Heartbeat of the Sun from Principal Component Analysis and prediction of solar activity on a millenium timescale V. V. Zharkova, S. J. Shepherd, E. Popova & S. I. Zharkov
4.2 Personal Sunspot Watch:
Monitoring incoming cosmic rays requires sophisticated instruments. So does the monitoring of coronal holes and solar flares in wavelengths outside the visible spectrum. For this, we rely on space weather observatories. A very strong solar eruption can be seen with a simple telescope projection, as did Carrington in 1859, when he registered the solar storm that caused global aurora anomalies, atmospheric storms and ground induced currents that crippled the telegraph system.
The count of visible sunspots can provide a very rough, low-tech overview of the trend in solar activity, even without electricity or intranet access, using only a pair of binoculars or a telescope. For a detailed measure of solar activity (especially before 1600) proxies such as beryllium 10 isotopes and carbon 14 isotopes are used.
Accurate sunspot records were made since 1610. Old Chinese astronomical records mention sunspots that were seen with the naked eyes in a hazy sunset. For a more accurate interpretation of the sunspot’s output, we would also need to know the magnetic polarity values of sunspot groups.
Warning: never look into the sun!
However, keep in mind, to compare sunspot records of the 1600s to 1900s with today’s sunspot numbers must lead to inaccurate results. Today, observation is performed with space based high-tech equipement with special optical filters. The telescopes that were available in the early 1600s to Kepler and Galileo were far inferior to today’s even cheap common telescopes. Galileo initially had a 8x magnification available with hand polished lenses made of hand-blown glass. So, sunspot group numbers of before around 1900 only give a accurate picture of solar activity when controlled with proxy data such as Beryllium10 or Carbon14 data. Online sunspot observatories visualize and count minute sunspots even without umbra regions which are barely visible with a small telescope, let alone with a pioneer technology telescope of the 1600s. Read more on the comparison here.
Thus far – in the first two months of Feb 2018 – we had only two sunspot groups with sunspots dark and large enough to be easily visible with a simple telescope. (See the projection from 2-23 below). In comparison, Space weather Live.com has already listed 25 sunspot regions in 2018 (in the first two month).
So, as far as visually recorded sunspot numbers are concerned, we could momentarily be at levels comparable to the Dalton Minimum.
At the beginning of 2018, we are already more than 2 years ahead of the bottom of the solar cycle. The next time you see notable sunspots on an internet sunspot monitor, see if you can spot them in a projection with your telescope. This gives you a rough reference point for independent sunspot observation, even if you don’t have internet access or electricity. Here is how to do it:
Simply mount your binoculars or teleskope in such a way that they project a cone of sunlight onto a white surface in the shade. Experiment with distance and focus.
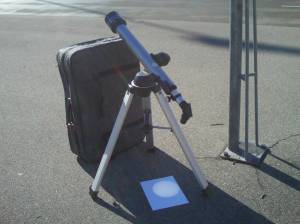
Fig 8:Sun spot observation with telescope Simply mount your binoculars or teleskope in such a way that they project a cone of sunlight onto a white surface in the shade. Experiment with distance and focus.

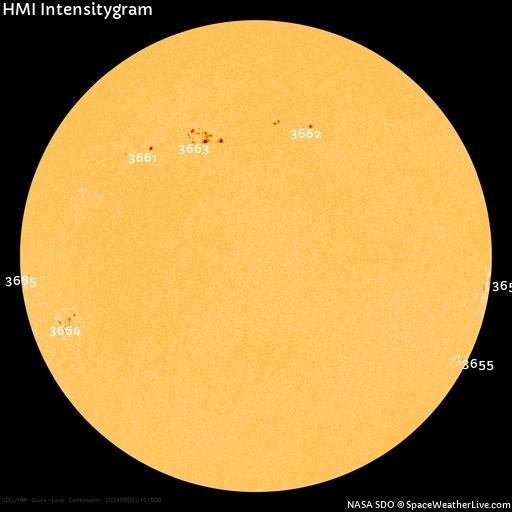
Fig 9: Sunspots visualized on sdo, 2-13-2018
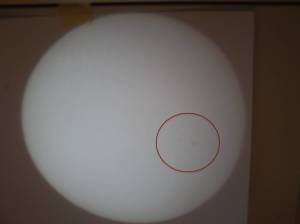
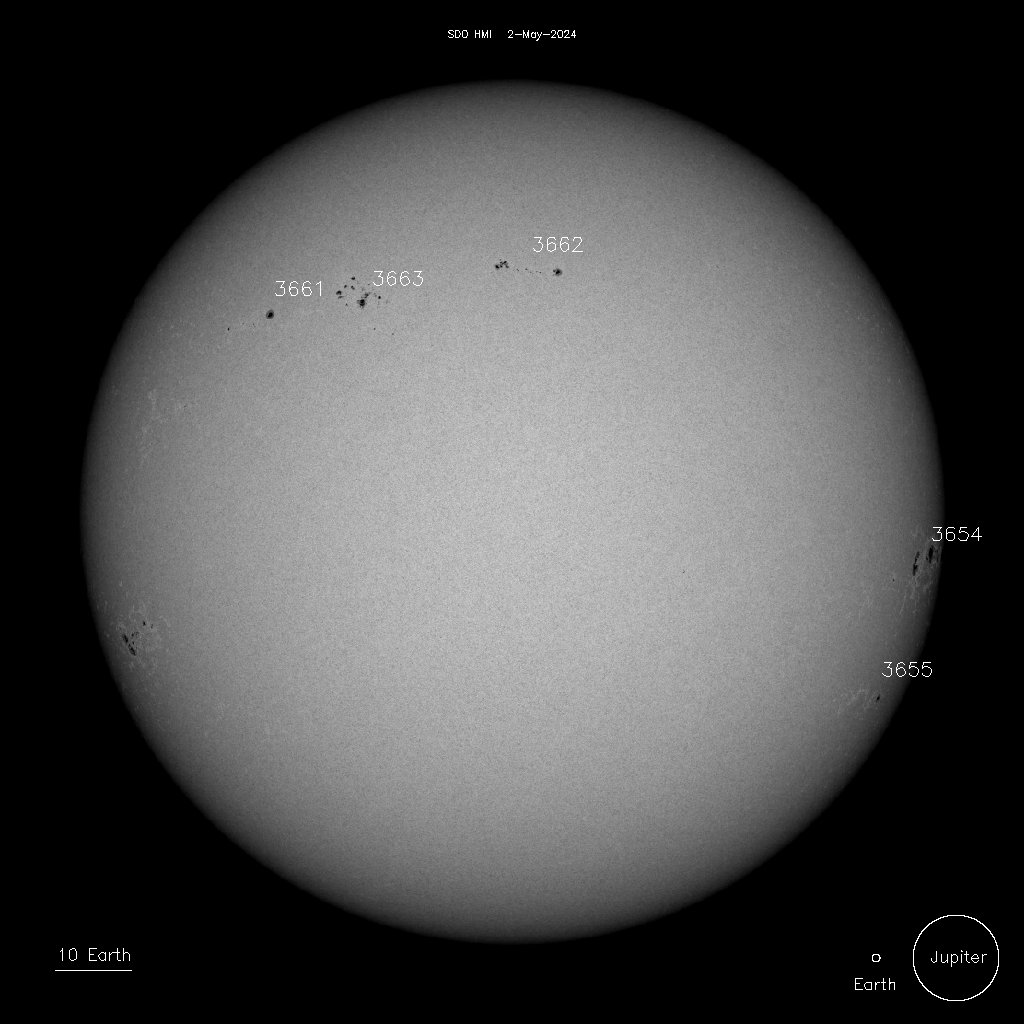
Fig: 10: Unfiltered photograph of telescope projection, Sun spots 2-13-2018. A group of medium sized sunspots (thus far the largest of 2018) in the sun’s equatorial region. As the sun rotates, the sunspots traverse the observed side of the sun in about 9 days from left to right
In closing:
For more details on the latest insight on cosmic rays, read the 2017 press release on Professor Henrik Svensmark’s paper here:
“Finally, we have the last piece of the puzzle of why the particles from space are important for climate on Earth.”
Whenever the final drop into the next Grand Solar Minimum will turn out to be, we are a society in need to prepare and re-organize our infrastructure and way of life to a changing environment.
Sacha Dobler 2018
Addendum:
One counterpoint to Svensmark‘s line of argument was the following attempt by Dr. Leif Svalgaard. Antony Watt wrote:
“I asked prominent solar physicist Dr. Leif Svalgaard his opinion on the paper (and sent him the advance full copy). He had this to say”:
“Think about this: TSI over a solar cycle causes a variation of 0.05-0.10 degrees C. If GCRs as per Svensmark has 5-7 times the effect of TSI, that would translate to a temperature variation of 0.35-0.50 C over a cycle, which is simply not observed, hence the paper can be dismissed out of hand.”
Well, it is Dr. Leif Svalgaard’s interjection and logical fallacy that can be dismissed out of hand, since the solar system is not a mechanical clockwork. He assumes the changes in temperature are a direct cause of the changes in TSI. And then he complains that we don’t measure the changes he projects from his false presumption. Maybe, the 5-7 times greater effect on temperature IS WHAT CAUSES the 0.05-0.01 degree difference over a solar cycle? Maybe the TSI is a co-effect?
Independent from the above discussion I find it interesting to pursue the question of whether it is academic authoritarianism that makes people feel compelled to start their sentences with “Think about this:…”
Categories: Astronomy, Geology, The Reneval of Earth, Weather


")
 begun: NASA predicts lowest solar cycle in 200 years")
")
![Kp-Index [0-3] Green - Stable/Calm Magnetosphere. [4] Yellow - Unstable Magnetosphere. [5+] Red - Geomagnetic Storm Conditions](https://firebasestorage.googleapis.com/v0/b/carrington-9.appspot.com/o/spaceWeatherNews%2FkpChart.png?alt=media)


Penis
LikeLike
Excellent article, more please.
LikeLike
Relatively new to this topic, this was a GREAT ariticle!
LikeLike