Natural Hazard World Map.
To enlarge, click here or go to front page, side bar–>

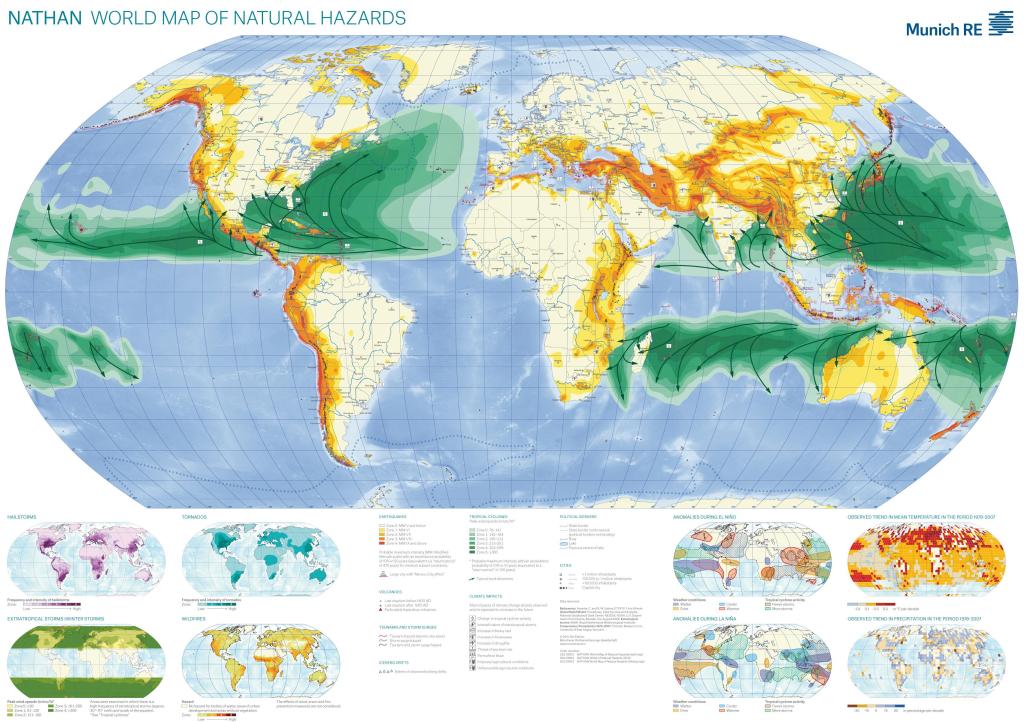
The following map was created by the insurance company Munich Re. This version was last updated in 2011 (click the link on top twice to enlarge for details). All the seismic and meteorologic hazards listed below for any given area are expected to increase during a Grand Solar Minimum. General high risk zones can be expected to be affected proportionally – in simple parlance, as a generalization: expect more of the same in any given location. Plus a long term overall cooling. The map provides a handy base line overview on general geographic distribution of steady natural hazards.
It should be kept in mind that the producers work on the false premise that observed or expected effects of climate change are the result of anthropogenic greenhouse gases, and also take into account that the trends in mean temperature are taken from data of the IPCC and associate, which have been proven to be fraudulent. Further, the map does not take into account that seismic phenomena have already been increasing in the last decade.
Neither does it consider the ongoing decline in Earth’s magnetic field, the decline in solar magnetic field strength and the measured increase in cosmic ray influx. If the trends continue, more incoming cosmic rays act as condensation nuclei and propagate more cloud formation, storms, hurricanes and drought. At the same time, cosmic rays increase vulcanic eruptions. The ongoing rise in seismic activity has not been considered in the map.
As we saw in 2017 the bands of Hurricane strength tropical storms already had to be extended to Ireland, Portugal and the Mediterranean.
Not included in the list are local flooding risk areas (river valleys and plains), landslides, avalanches, droughts and the long term ramifications of increased snow cover and glacier advancment.
The main map includes:
Earthquakes
Tropical Cyclones
Volcanoes
Climate impacts (Main impacts of climate change already observed and /or expected to increase in the future.
Tsunamis and storm surges
Iceberg Drifts
Additional maps show:
Hailstorms
Extratropical storms (Winter storms)
Tornadoes
Wildfires
Anomalies during El Nino
Anomalies during El Nina
The map might even be consulted in considerations of strategic relocations.


Leave a comment