

Finally, it looks as if the GSM is on.
First, this is not a 100% conformation that the Next Grand Solar Minimum has already begun, even though the data strongly indicates that the trends will continue according to the models of Zharkova et al, 2015, Ole Humlum 2011 John Casey and many others. The different models vary in duration. (see details in the introduction to the next Grand Solar Minimum.)
On June 12, 2019 NASA announced:
Solar Activity Forecast for Next Decade Favorable for Exploration
“The forecast for the next solar cycle says it will be the weakest of the last 200 years. The maximum of this next cycle – measured in terms of sunspot number, a standard measure of solar activity level – could be 30 to 50% lower than the most recent one. The results show that the next cycle will start in 2020 and reach its maximum in 2025.”
The beginning of a Grand Solar Minimum can only be definitely declared after several very low solar cycles (11- year-cycles or Schwabe cycles). A decline of 30- 50% in sunspot numbers already brings us to Dalton Minimum levels.
It must also be said that the Dalton Minimum itself is by some astronomers declared to have been only an incomplete Grand Solar Minimum . (Usoskin et al, 2011,) [iii]
The next Grand Solar Minimum is not only good news. The bad news is climate disruption (real natural climate change, not anthropogenic climate change), erratic precipitation, increased flooding, storms, droughts, crop loss, population pressure/ reduction, migration and in the long run, global cooling.
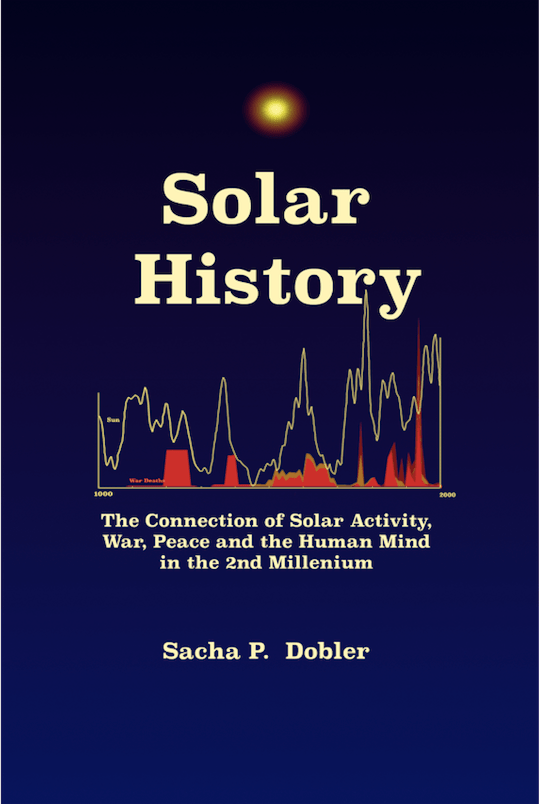
The good news is a long- term historical trend of general peacefulness, rationality and improvements in the implementation of human rights for the remaining population (as I proved in my book Solar History). The empirical reduction in violence and increase in responsibility could be the next closest thing to what esoteric people call an “awakening”.
Compare the current state of the sun to the Dalton Minimum conditions. Here, I added a sketch of the NASA projection to the end of the solar cycle progression of the last 400 years.

This graph compares the current solar progression to that of the Dalton Minimum. Original Graph by Anthony Watts / December 20, 2010. I added the recorded Solar Cycle 24 (green) and the NASA projection of solar cycle 25 (black dotted line). The similarities are striking.

“The Dalton Minimum was a period of low solar activity, named after the English meteorologist John Dalton, lasting from about 1790 to 1830.[1] Like the Maunder Minimum and Spörer Minimum, the Dalton Minimum coincided with a period of lower-than-average global temperatures. The Oberlach Station in Germany, for example, experienced a 2.0°C decline over 20 years.[2] The Year Without a Summer, in 1816, also occurred during the Dalton Minimum. Solar cycles 5 and 6, as shown below, were greatly reduced in amplitude.” Antony Watts.
Even more than ten years ago: NASA’s Dr. David Hathaway accurately predicted that solar cycle 24 (that peaked in 2014) would be the weakest solar maximum since 1928. From the NY Times 2009:
“Still, something like the Dalton Minimum — two solar cycles in the early 1800s that peaked at about an average of 50 sunspots — lies in the realm of the possible, Dr. Hathaway said.”
Possible causes of the instigation of the non-periodical Grand cycles
Geoff J. Sharp proposed that Angular Momentum influenced by Uranus & Neptune are Responsible
The Angular Momentum perturbation and modulation (as observed in graphs produced from the Jet Propulsion Laboratory) is a direct product of the outer gas giants (Uranus & Neptune). This information gives the opportunity to predict future grand minima along with normal solar cycle strength with some confidence. A proposed mechanical link between solar activity and planetary influence via a discrepancy found in solar/planet AM along with current AM perturbations indicate solar cycle 24 & 25 will be heavily reduced in sunspot activity resembling a similar pattern to solar cycles 5 & 6 during the Dalton Minimum (1790-1830). [1]
–
Earth, Venus, and Jupiter alignment and Schwabe cycles
A team of researchers found that the tidal forces are strongest when Earth, Venus, and Jupiter align, and that this alignment occurs every 11.07 years – falling at the same time as the solar minimum. [1]
“During the period 1874 – 2017 the Morlet wavelet power spectrum of the north–south asymmetry () of sunspot-group area and that of the mean absolute difference of the orbital positions of the giant planets are found to be similar.” [2]
[1] Stefani F. et al, 2019: A Model of a Tidally Synchronized Solar Dynamo; Solar Physics volume 294, Article number: 60 (2019)
[2] Javaraiah J. 2020: Long-term Periodicities in North–south Asymmetry of Solar Activity and Alignments of the Giant Planets; Solar Physics volume 295, Article number: 8 (2020)
[1] Are Uranus & Neptune Responsible for Solar Grand Minima and Solar Cycle Modulation? Geoff J. Sharp; International Journal of Astronomy and Astrophysics Vol.3 No.3(2013),


Leave a comment